Spot the direction
Read rising, falling and sideways traffic using historical comparisons, sparklines and moving averages.
 Trenscope
See which websites are gaining momentum, which are slowing down, and where your visitors come from. Bring your Google Analytics reports together in one organised workspace.
Free interactive demos · No Google connection needed · Fictional sample data
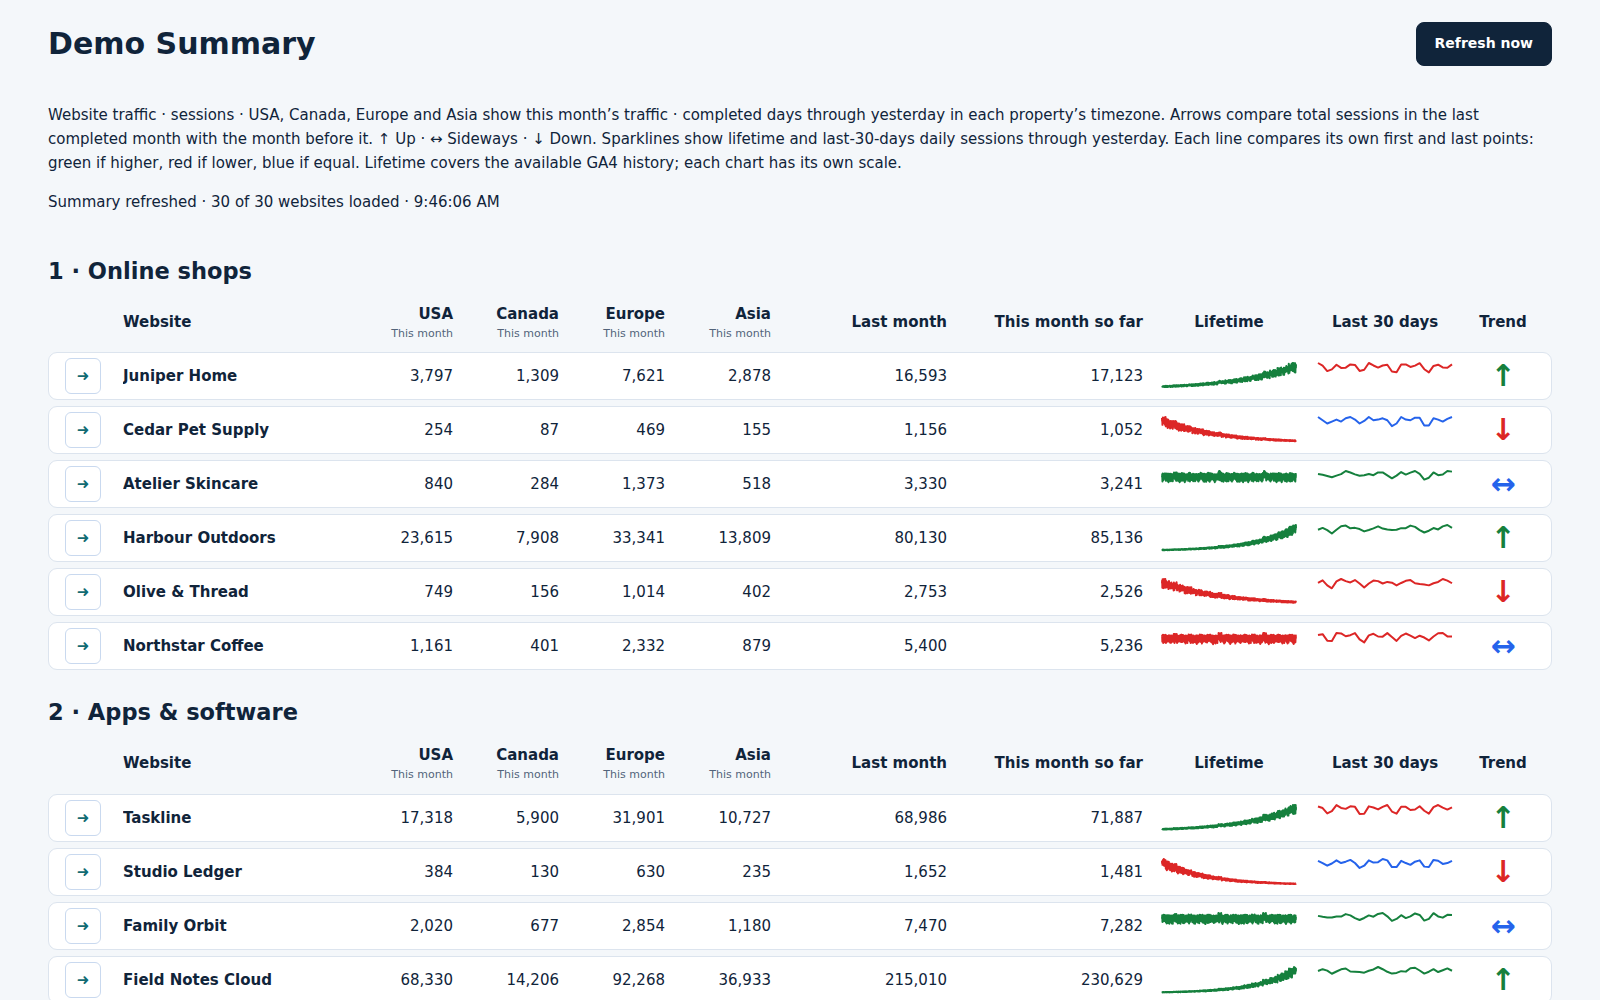
Keep your portfolio in order, compare its traffic, and open an individual website when you need the detail.
Read rising, falling and sideways traffic using historical comparisons, sparklines and moving averages.
Organise shops, apps, publications and client websites into your own groups, with an order you choose.
Compare regional sessions at a glance, then explore country totals and their percentage change.
Use Google sign-in when approved, or a service-account JSON key. Assign the correct saved connection to each website.
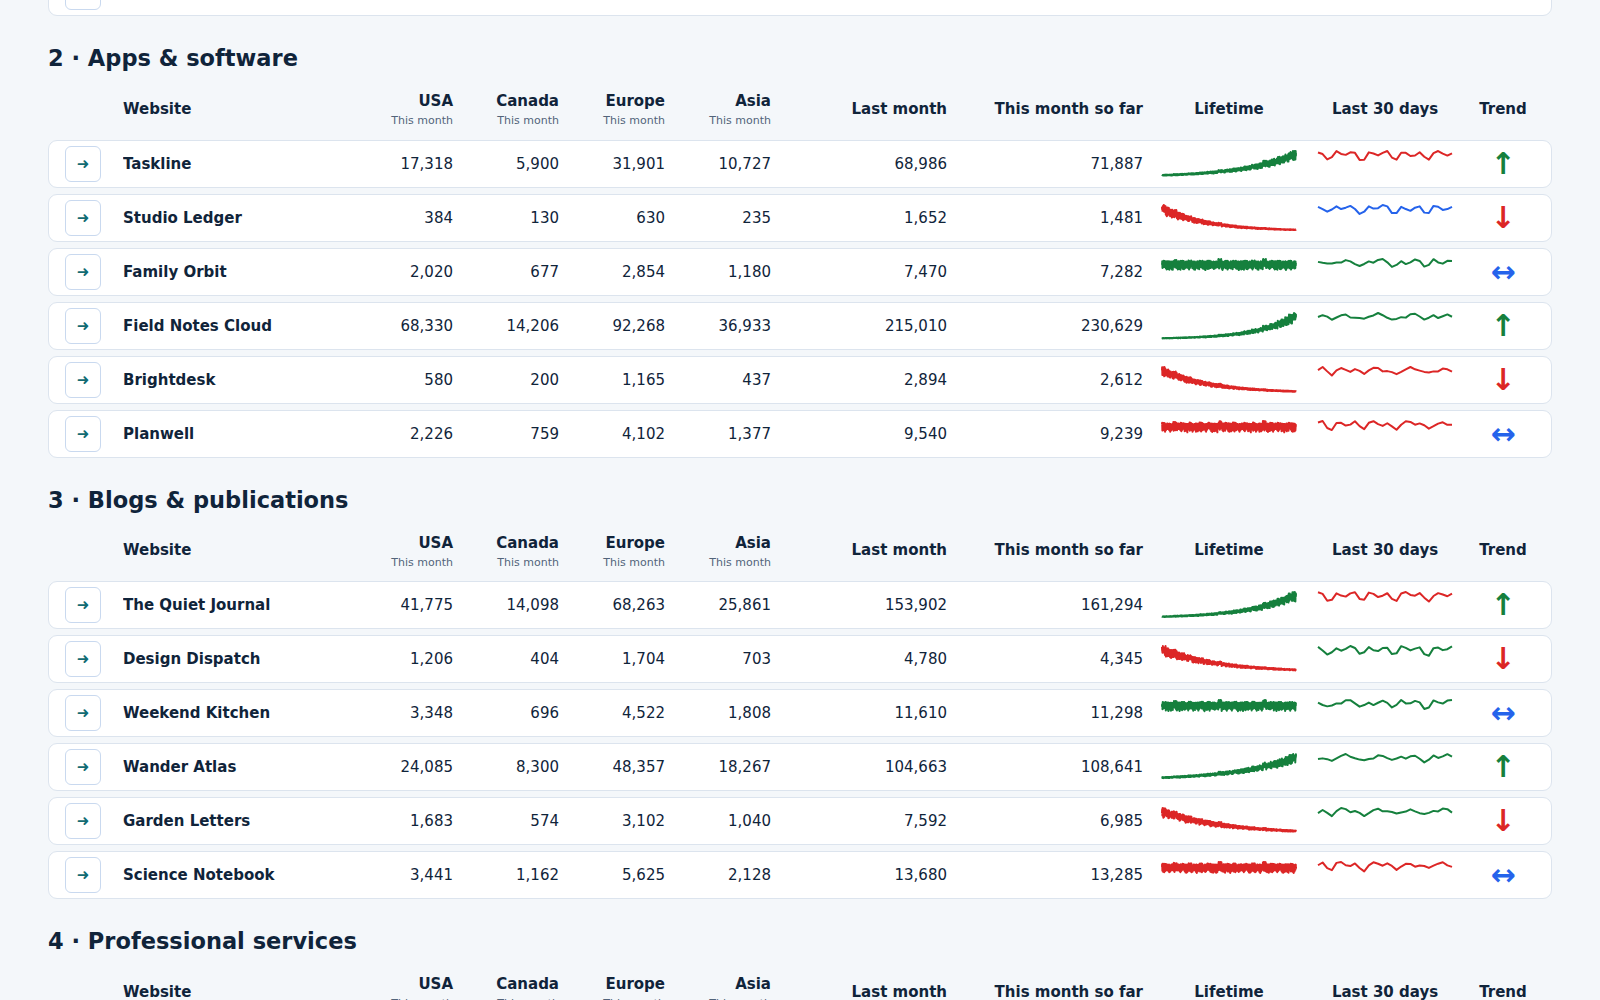
Review many websites without opening thirty separate reports. The Summary puts the important readings side by side, grouped the way you work.
Keep clients, shops, apps and publications together. Group names sort A–Z, then each website follows its saved Order number.
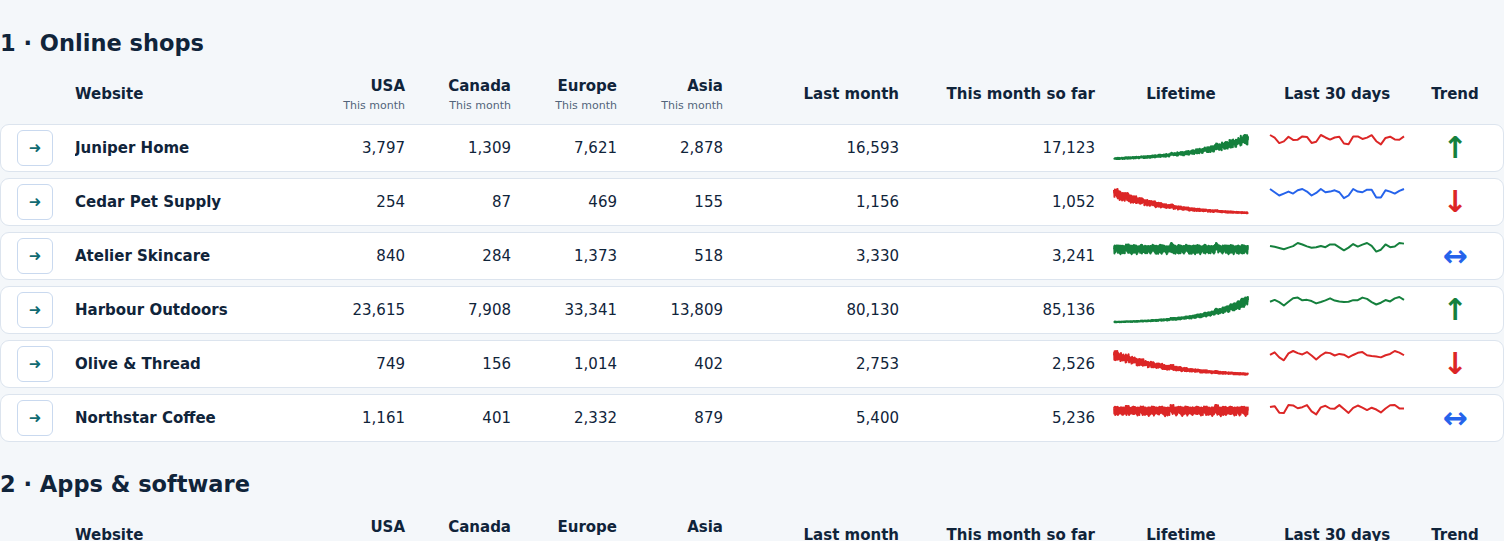
See USA, Canada, Europe and Asia sessions for the month’s completed days. The same regional figures are available in each website’s Dashboard report.
Compare last month with this month so far. Lifetime and last-30-days sparklines show the shape of each website’s recorded traffic.
Trend arrows compare the two latest completed months. Select a website’s arrow button to open its matching Dashboard card.
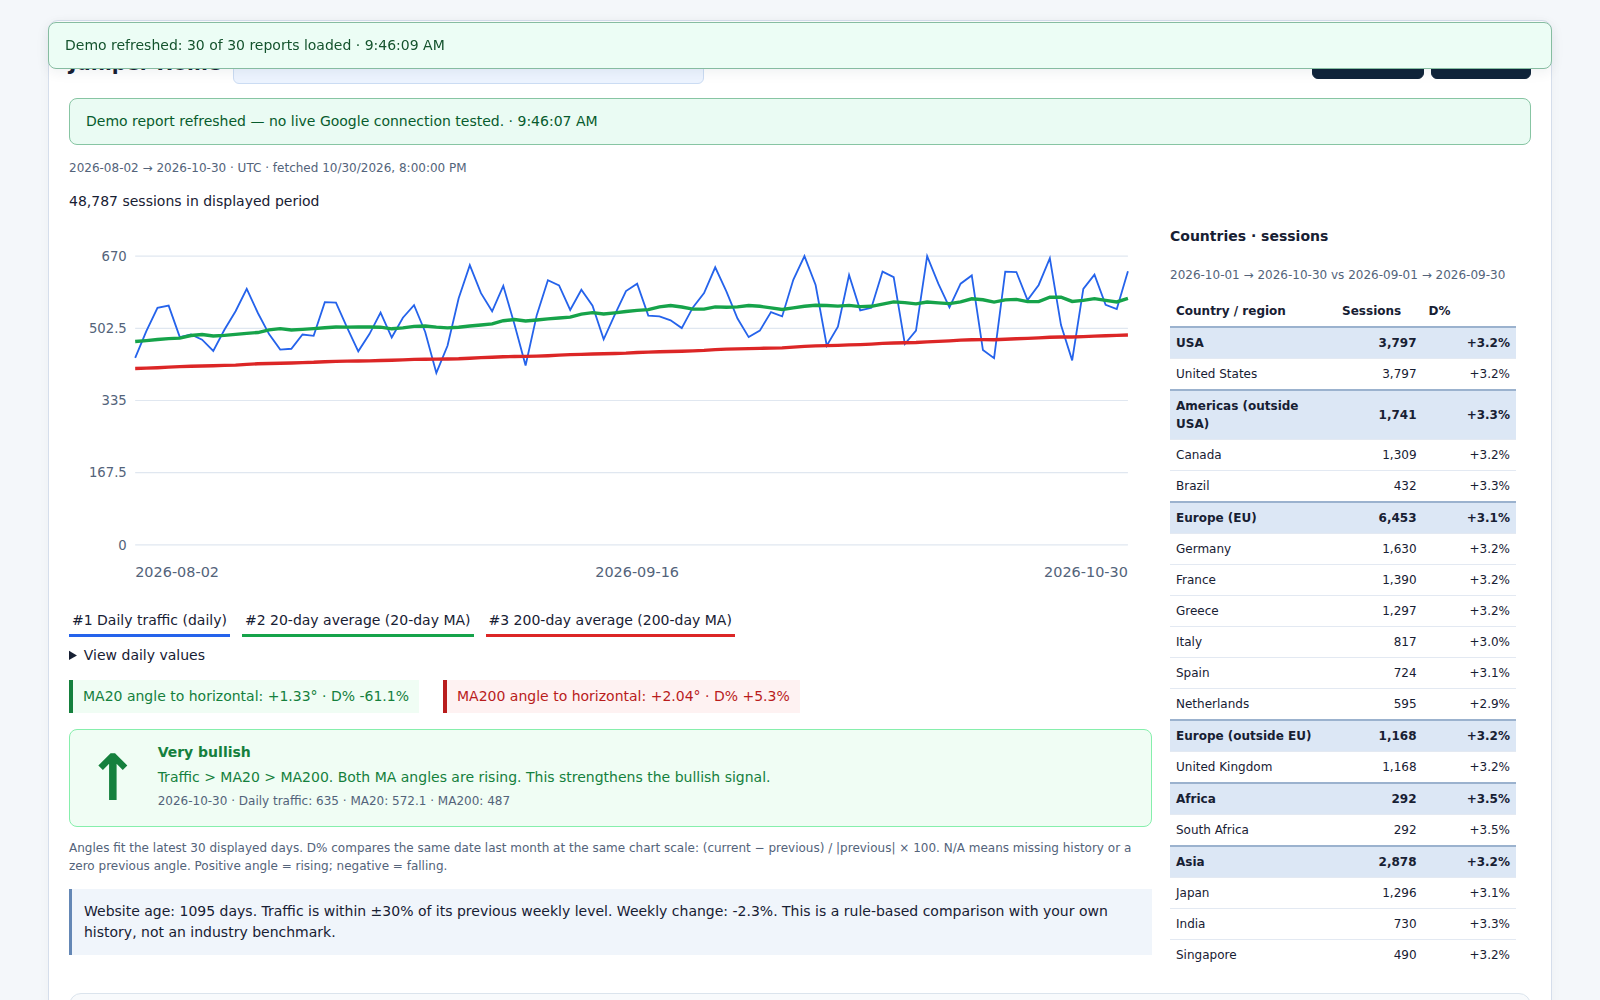
Move from a quick overview to the full report. Each website has its own chart, country breakdown and historical traffic assessment.
View sessions, page views or daily active users. Compare the daily line with 20-day and 200-day moving averages, with periods up to a year.
Read moving-average angles, monthly D% comparisons and bullish, bearish or mixed conditions. These describe recorded history; they are not forecasts.
Explore country sessions, regional totals, comparable-date percentage changes and the world map alongside each chart.
Choose one, two or three websites across. Filter groups, sort reports, jump to a website and print or save a PDF. Test and refresh feedback appears on the relevant card.
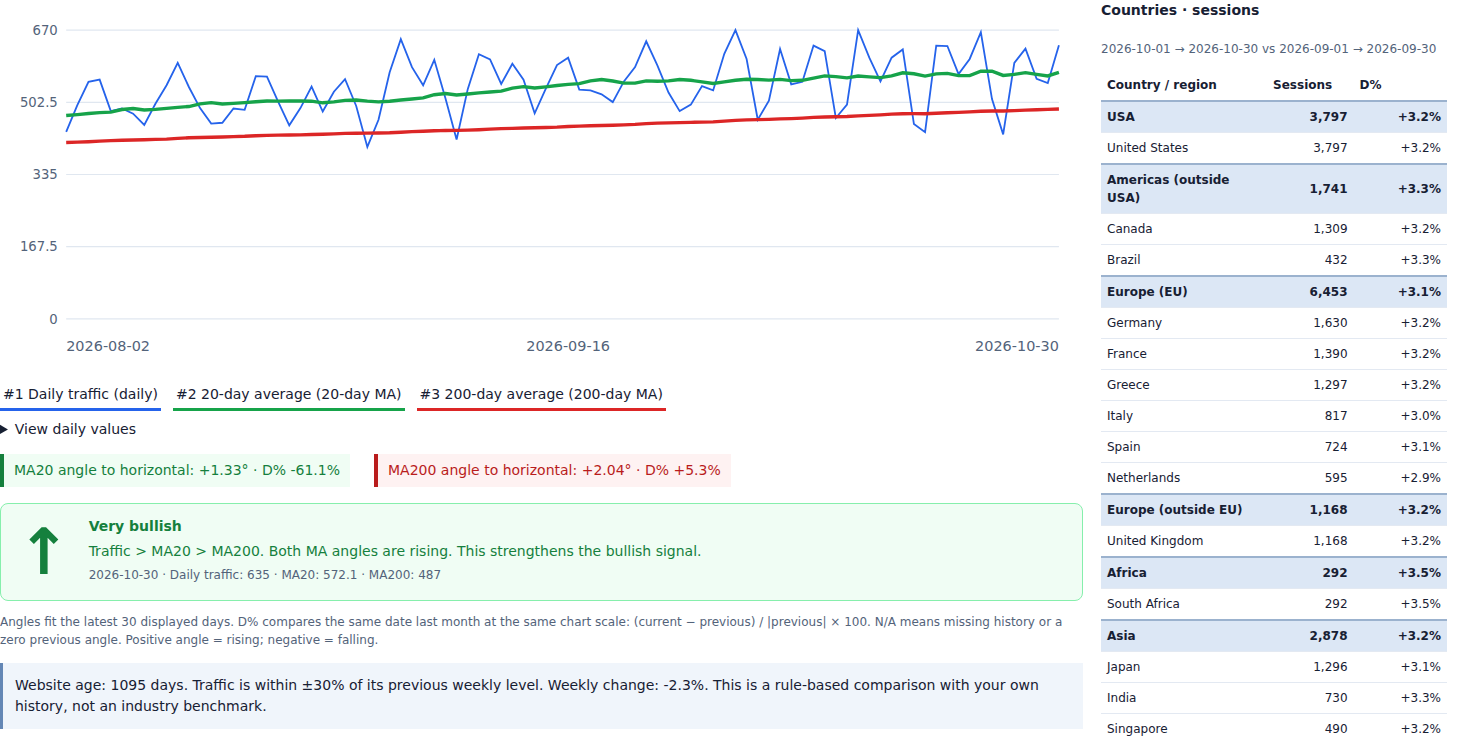
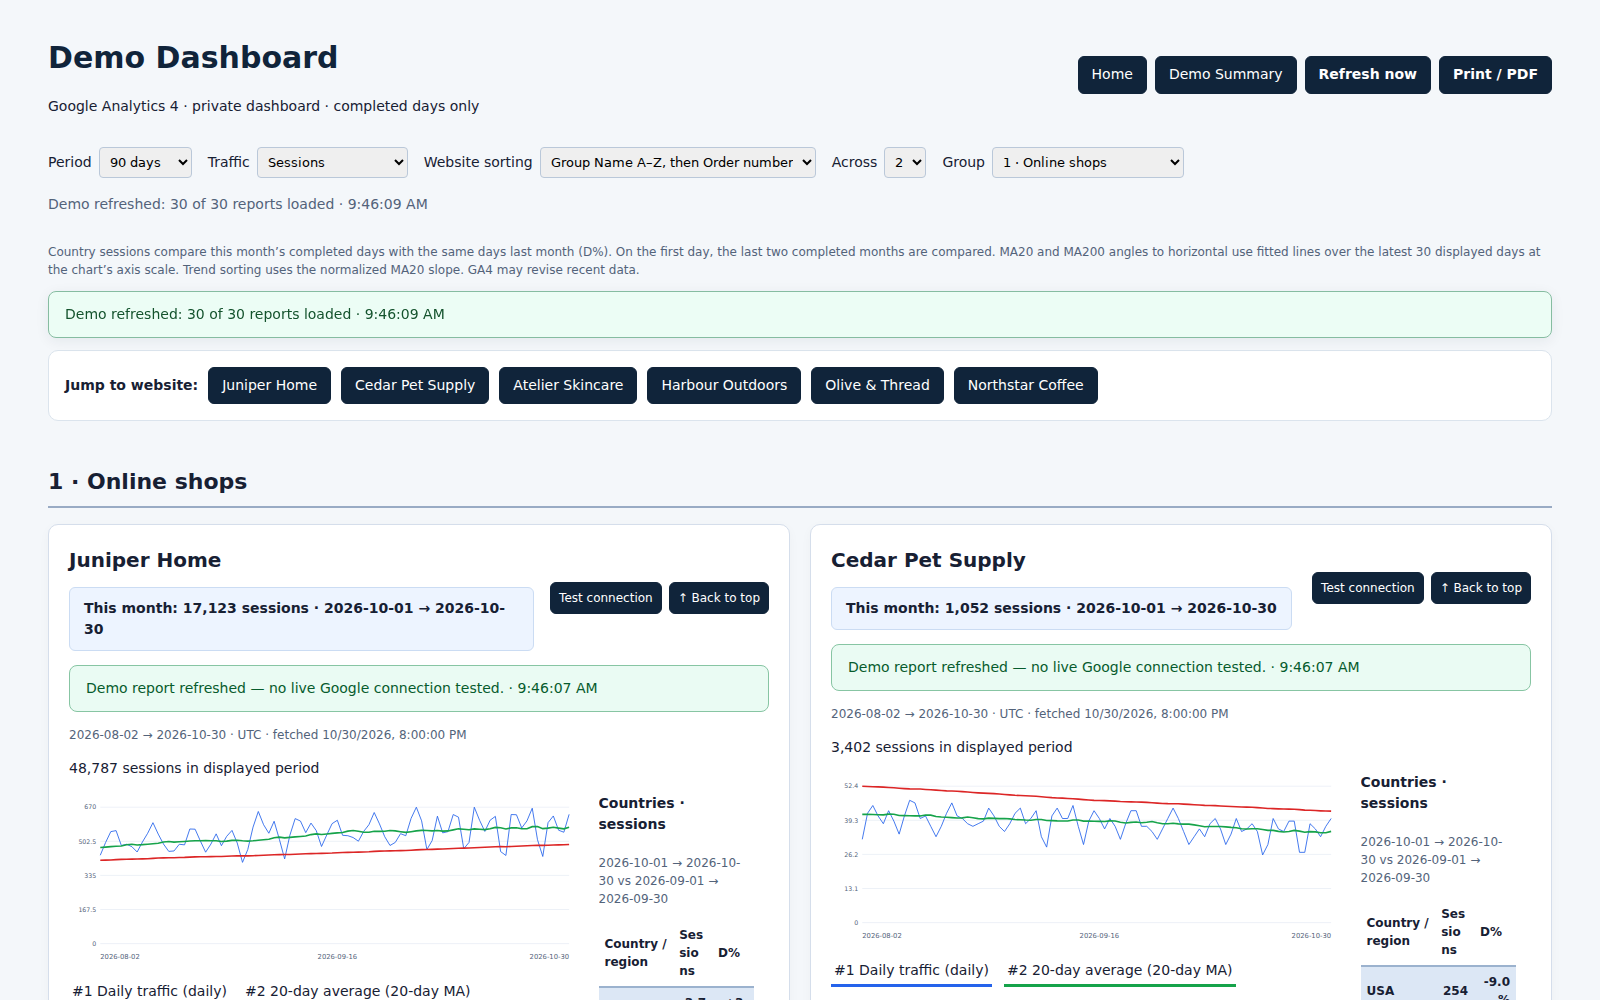
Understand the 20-period and 200-period simple moving averages, then see how the same smoothing idea helps you read website traffic.
See the daily traffic line together with highlighted rising, steady and declining areas.
English synthetic narration · fictional demonstration data
Explore the Dashboard map, reporting dates, country sessions and colour scale.
English synthetic narration · fictional demonstration data
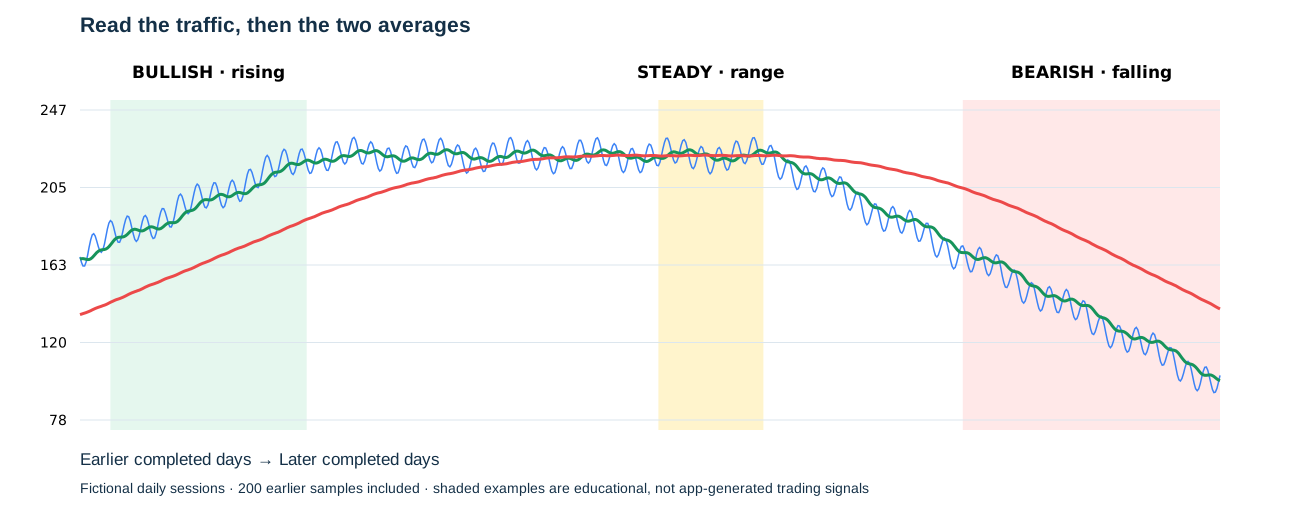
Add the last 20 values and divide by 20. Each new value moves the window forward. This shorter average responds sooner to recent changes.
Add the last 200 values and divide by 200. This longer window smooths more daily variation and takes longer to reflect a change.
Price or traffic sits above MA20, MA20 is above MA200, and both averages rise. This is an example of aligned historical upward momentum.
Flat averages with values moving around them suggest a range. Conflicting slopes or line positions are mixed conditions; mixed does not automatically mean steady.
Price or traffic sits below MA20, MA20 is below MA200, and the averages fall. This is an example of aligned historical downward momentum.
MA20 crossing MA200 changes the ordering of the averages. Crossovers lag the underlying movement and may reverse repeatedly in a range. They do not guarantee the next direction.
Historical S&P 500 daily chart displayed in TradingView. This reference screenshot is not a live quote. Red is MA20 and blue is MA200 in this example.
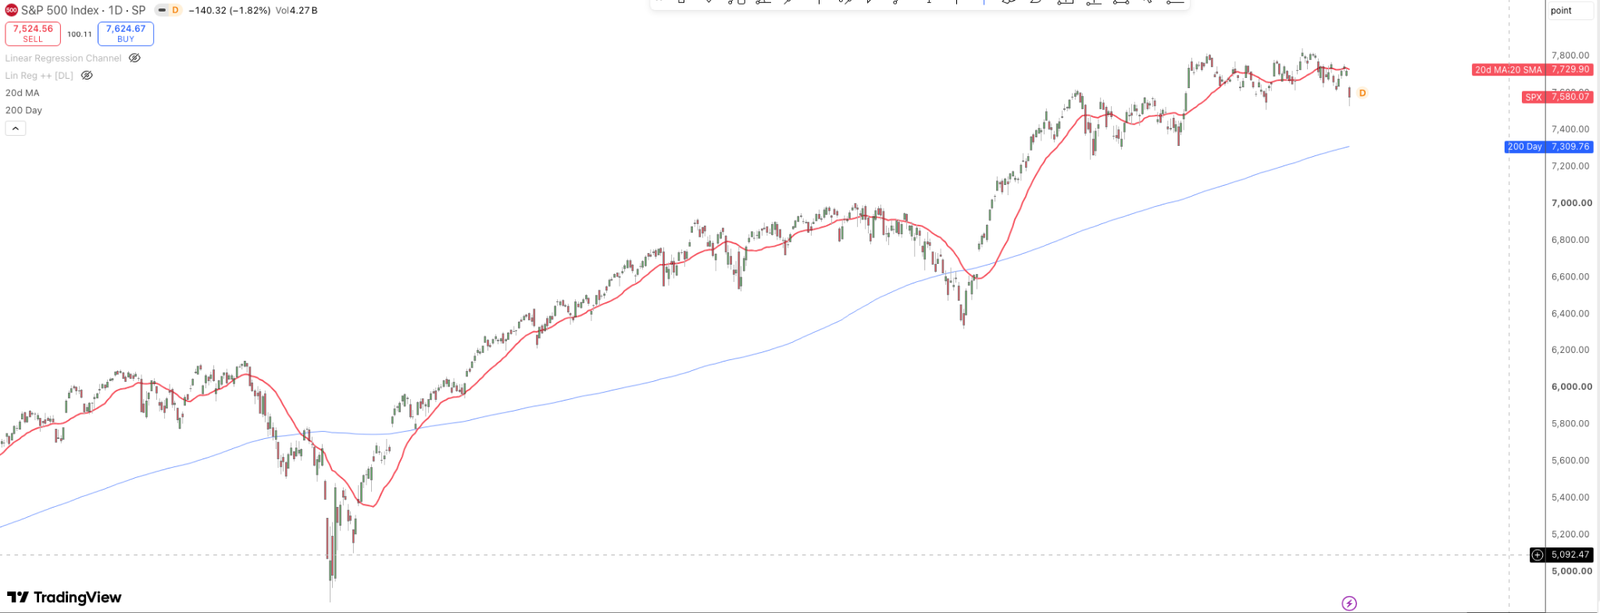
The screenshot does not contain a clear prolonged flat phase. The separate calculated traffic sketch above illustrates that condition.
On a daily stock chart, 20 and 200 usually count trading sessions. Trenscope uses completed calendar-day traffic, including weekends. Full MA200 requires 200 daily observations. Campaigns, seasonality and tracking changes can affect traffic.
The coloured areas above are teaching examples. Trenscope’s live traffic assessment also considers its displayed slopes and monthly comparisons; these shaded areas have not been added to customer reports. Historical readings describe the recorded data and do not predict results.
Further reading: Fidelity: simple moving averages · Schwab: moving-average crossovers.
All Trenscope Summary and Dashboard features, with no numerical limit on connected websites.
Unlimited connected websites.
One organised analytics workspace.
Explore 30 populated demo websites for free in both Demo Summary and Demo Dashboard. Connecting your own websites requires a subscription.
Monthly subscription. Stop renewal in Billing. Any applicable taxes and your final total are shown before payment.
Five groups, nearly three years of sample history, and a mix of growing, declining and steady traffic. Open a Summary row and find that same website, with the same data, in the Dashboard.
Demonstration snapshot: 31 October 2026 · fictional data through 30 October. Different trend indicators use the periods described beside them.
Trenscope reads authorised GA4 reports. Your websites must already have Analytics tracking and recorded data.
Open Connection Help and follow the steps for your connection method.
Select properties through Google sign-in, or enter each numeric GA4 Property ID for a JSON connection. Choose the saved connection on every website row.
Name your groups, set the website order and choose your layout. Use Summary for the portfolio and Dashboard for detailed reports.
Google sign-in is awaiting approval and is currently unavailable to customers. You can connect with a JSON key today.
Open Connection Help →Bring your authorised website reports together for €9.99 per month. Explore the free demos first, then connect your own portfolio.
Final total and applicable taxes shown at checkout. Subscription availability is limited to the countries listed below.