Use this guide to manage your websites and read reports after setup.
1. Trenscope account and registration
Create your Trenscope account
Create your Trenscope account
Read the instructions
Open Create account using the button below.
Enter your name, a valid email and a password of at least 12 characters.
Read and accept the Terms and Privacy notice, then select Create account.
Explore the free demos or open Billing to subscribe before connecting your own websites.
Checkpoint: you can log into your own Trenscope workspace. A Trenscope account is separate from your Google account.
Email already has an account
Use Log in, then Forgot password if necessary. Do not create another customer account to retrieve websites saved under the first one.
Account creation failed / invalid password
Check the email format, password length and Terms acceptance. Read the displayed error. If repeated attempts are blocked, stop retrying rapidly and contact support.
Log in, reset a password or recover missing websites
Log in or use Forgot password
Read the instructions
Open Log in and use the email or username of the Trenscope account that saved your websites.
If you forgot the password, select Forgot password on that page and follow the reset message.
If the message is absent, check spam and the address entered; ask support to check delivery if needed.
After logging in, check My Websites and Saved connections before adding duplicates.
I am logged in but my websites are missing
Confirm the correct Trenscope login. Each customer has private settings and credentials; using a different login does not display the first account’s data.
I can open the demos but not real reports
The demos are public. Reading your own websites requires subscription access. Check Billing while signed into the intended account.
Session expired / security check failed
Reload the current page and sign in again if asked, then repeat the intended action from a fresh form. Do not reuse old callback URLs or submitted forms.
Save your website settingsWebsite rows, groups and ordering
Read the instructions
Use Add website to insert a row. Fill its name, numeric Property ID and intended Connection.
Press Save settings to save the complete form and its row fields. Check the confirmation and any validation error.
The small Save beside Group saves only that group text immediately. It does not save edits in the row’s other fields.
With the default sorting, groups appear A–Z and websites then follow their Order numbers. Dashboard’s other sort choices intentionally change the ordering inside groups.
Delete removes the row from the form; Save settings commits the deletion. It does not delete the website or GA4 property.
Group numbers or other edits do not remain
Check the save confirmation and ensure you are using the correct save button. If the site reports that its saved settings changed, reload My Websites before editing again.
A row is not visible in Dashboard
Confirm the row remains after saving, clear the Dashboard group filter, and refresh. Check subscription access and any loading error rather than adding duplicate rows.
3. Reading Summary and Dashboard
Test connection, refresh and error colours
Refresh reports from the DashboardReport status and Dashboard controls
Read the instructions
Use Test connection on a website card to check that row, or Refresh now to reload all websites. Progress and the final result appear on the card itself, as well as at the top.
Testing / refreshing: the request is in progress. Wait for its result.
Green success: the report request succeeded. If no daily rows were returned, the message says so; that is different from denied access.
Red error: read the exact message, then use Connection Help.
Cached report: recent cached data is distinguished from a confirmed live connection.
Settings changed: reload and check the website configuration before testing again.
Quota or timeout errors can require waiting and retrying. Persistent network, API-configuration or server-clock errors require the website owner’s help; do not repeatedly replace working credentials.
Zero traffic, incomplete months and differences from Analytics
Check the dates and metric on the report
Read the instructions
Reports use completed days through yesterday in the property’s timezone. Today’s Realtime count is not the same report.
On the first of a month, this month through yesterday has no completed days. Zero then does not by itself indicate a broken connection.
Match the Property ID, dates, metric, hostname filter and timezone when comparing with Google Analytics.
Missing tracking, consent effects, processing delays or a new property can leave no history to display. Trenscope does not recreate uncollected visits.
GA4 thresholding, sampling or other-row aggregation can make data incomplete. Read the report notes.
Summary totals, regional columns, sparklines and arrows
Summary totals and traffic trendsRegional columns in Summary
Read the instructions
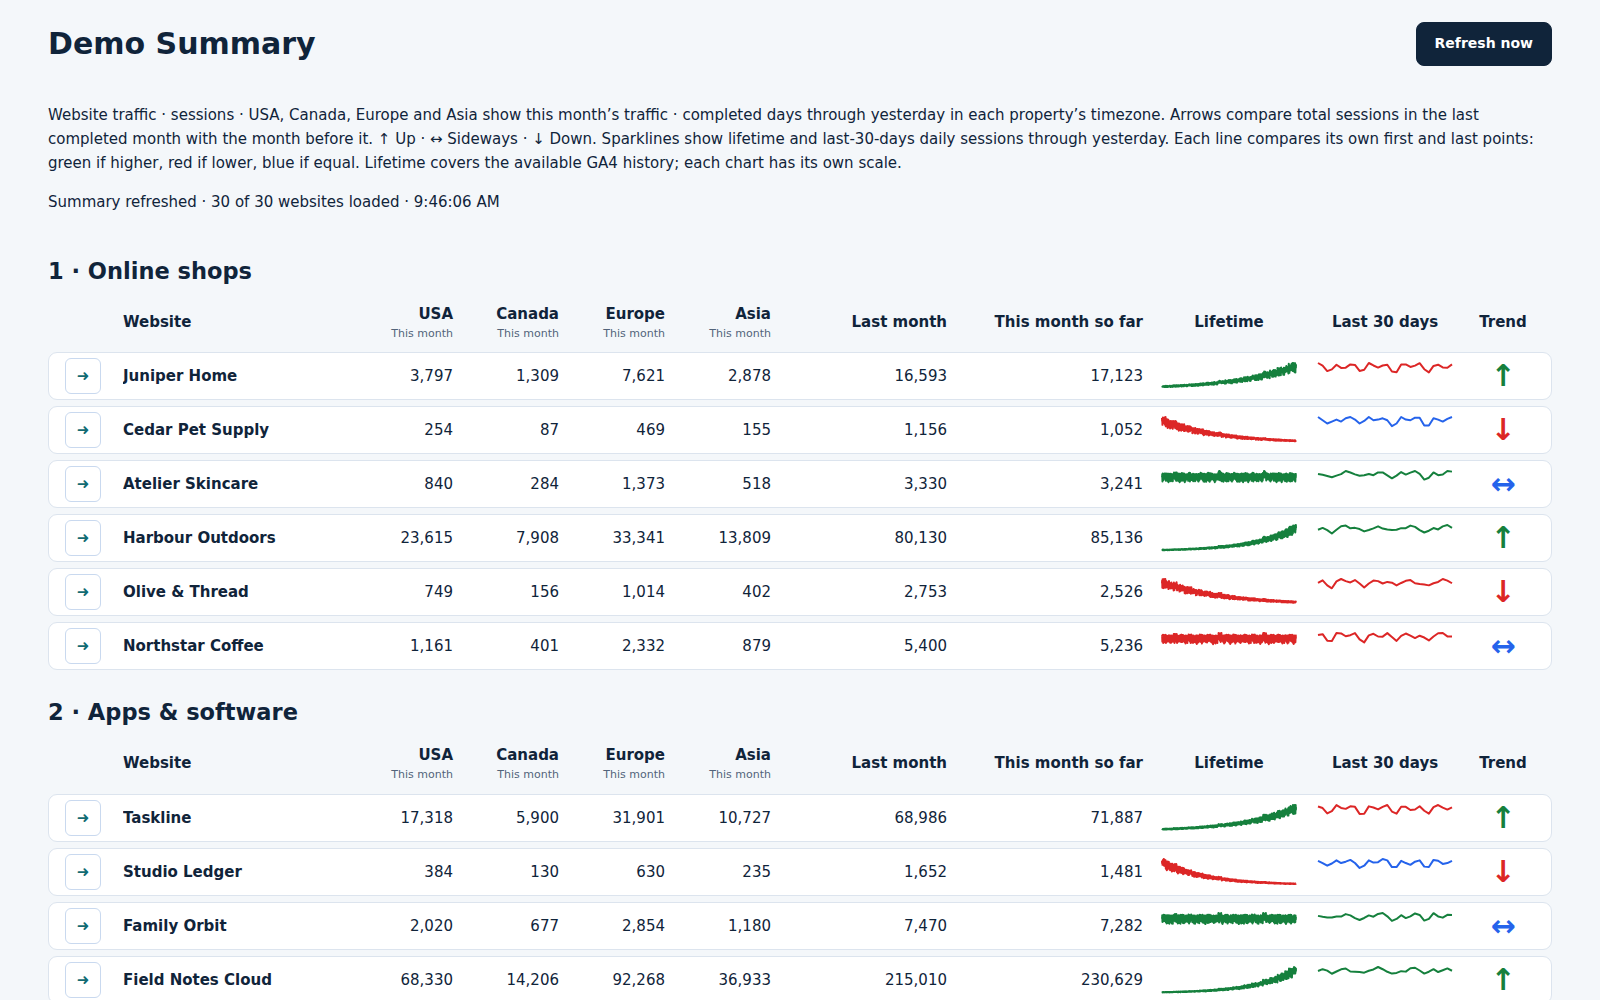
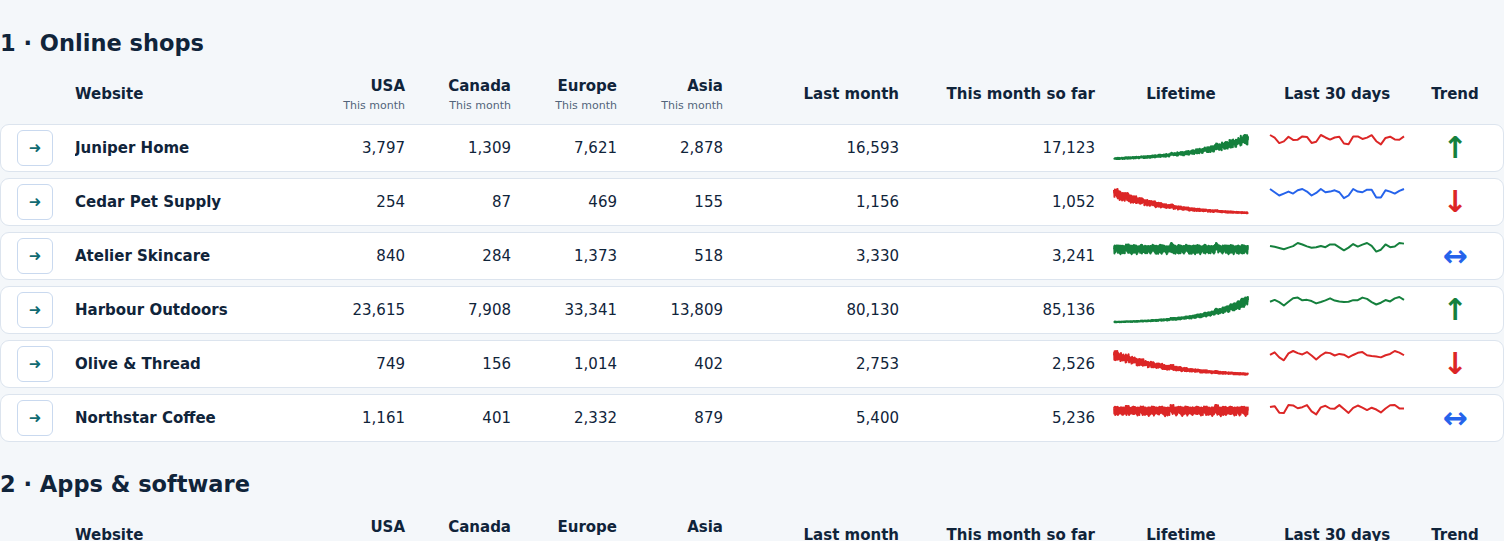
Last month is a completed calendar month; this month so far is a shorter elapsed period until the month ends. Do not treat those two columns alone as a like-for-like growth rate.
USA, Canada, Europe and Asia show sessions for this month’s completed days.
The arrow compares totals for the latest completed month and the preceding completed month. Equal totals produce Sideways.
Lifetime and last-30-days sparklines show daily sessions at each website’s own scale. Their colour compares first and last valid points; it does not have to match the monthly arrow.
The row’s arrow button opens that exact website’s Dashboard card.
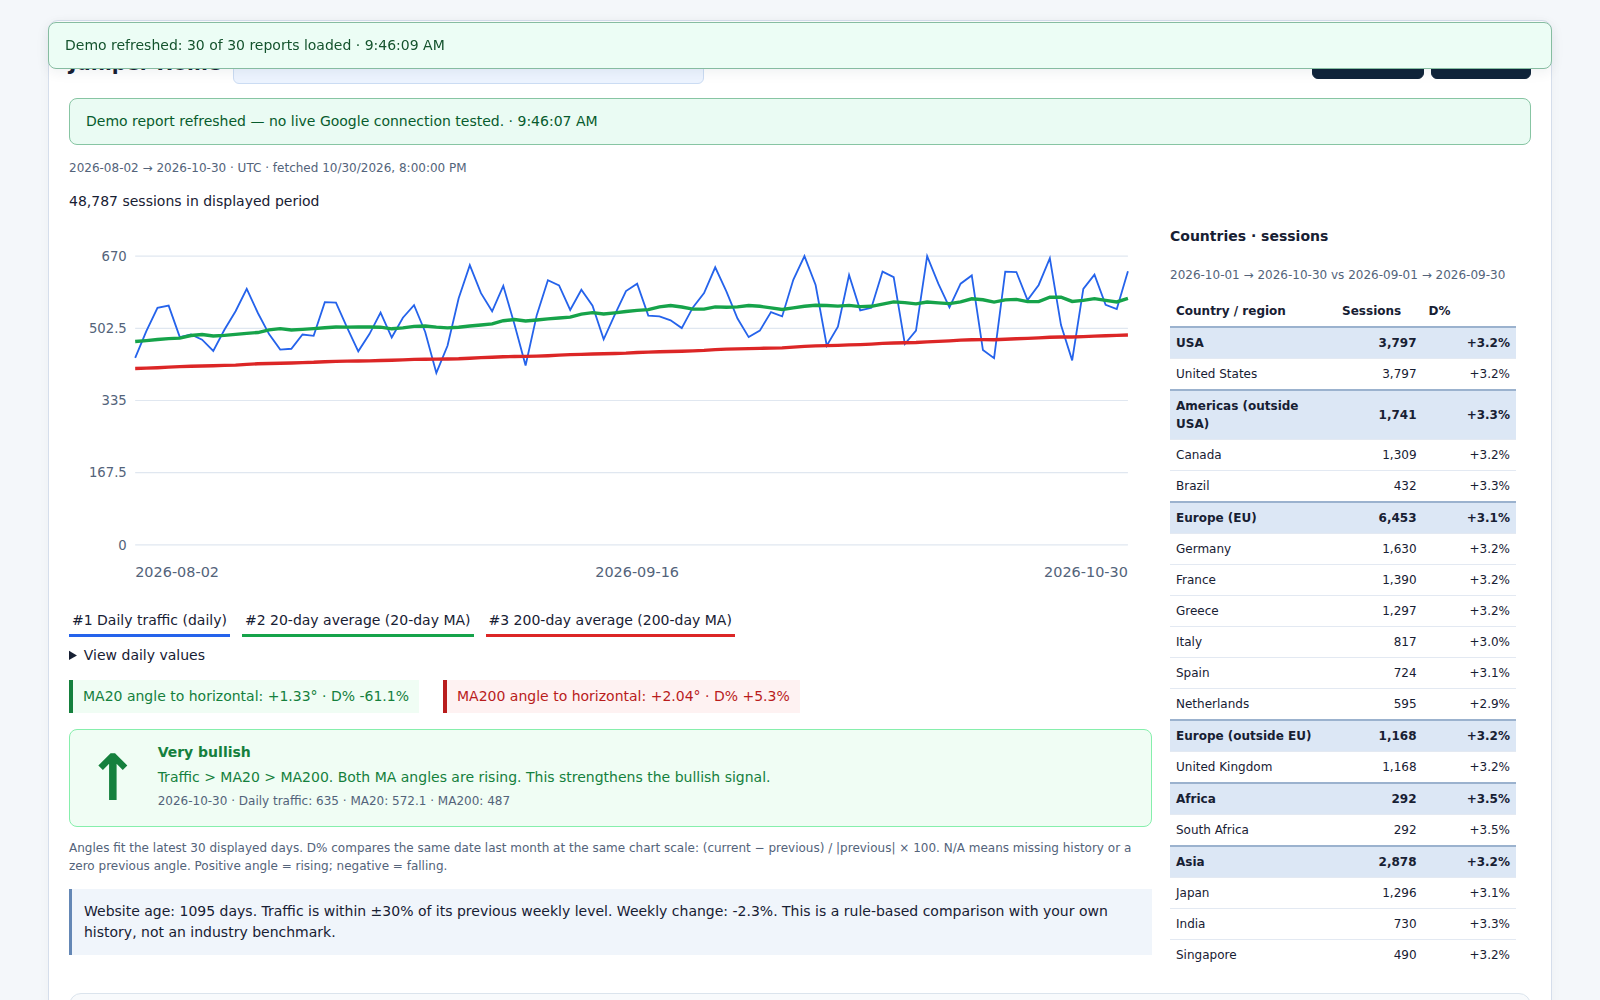
Dashboard splits Europe into EU and outside-EU regional groups; Summary Europe combines both.
Moving averages, angles and historical traffic signals
Moving averages and traffic signals
Read the instructions
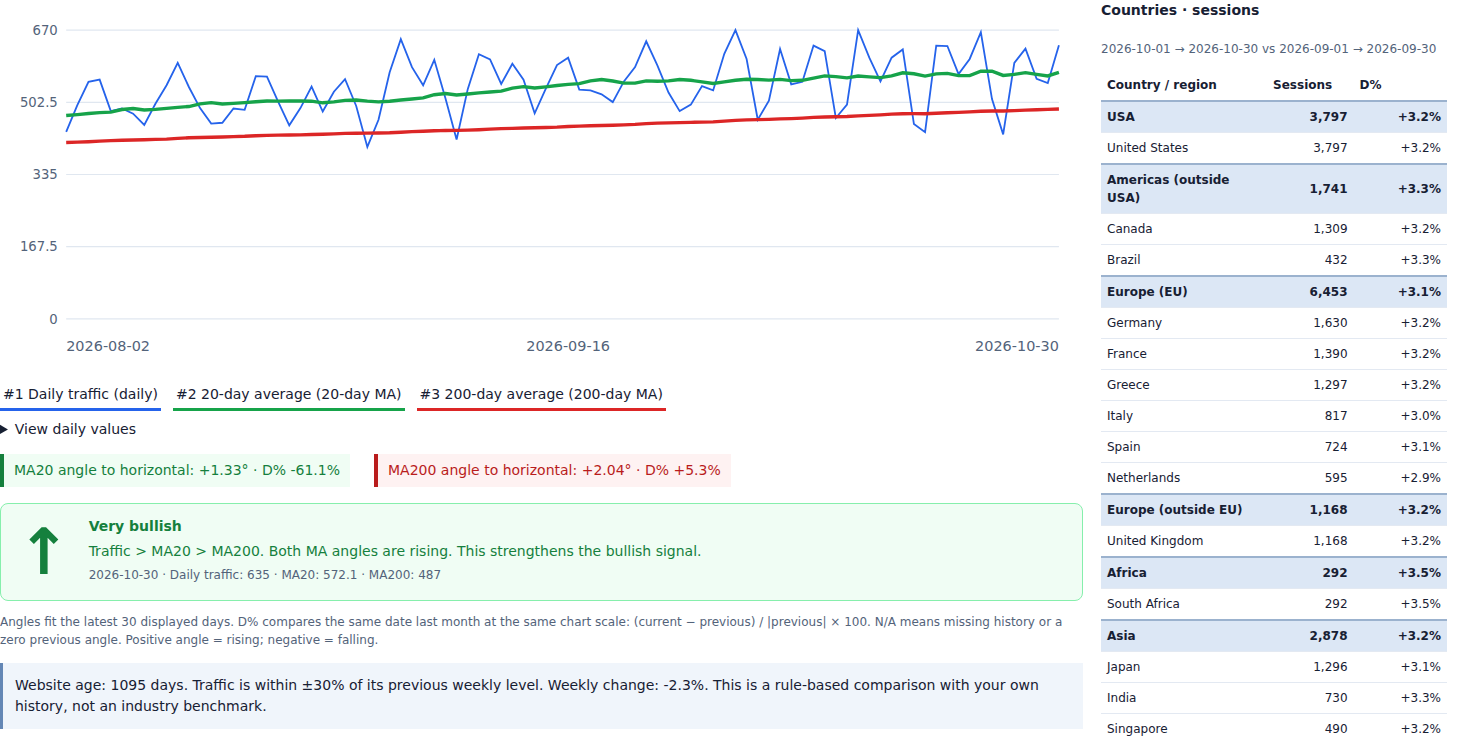
The default blue line is daily traffic, green is the 20-day simple moving average, and red is the 200-day simple moving average. Saved chart-line settings can change names, colours and visibility.
Full consecutive history windows are required. A new website may not yet have MA200. Check available history and a correct launch date; do not backdate a site just to force an indicator.
Angles are fitted over the latest displayed points described in the report. Their degrees depend on the chart scale. Angle D% needs a valid nonzero previous reading; otherwise N/A is appropriate.
Traffic above MA20 above MA200, with rising average angles, supports the app’s very bullish reading. Reversed ordering with falling angles supports very bearish. Conflicting conditions can be neutral.
These are historical readings, not forecasts, sales measurements or guarantees.
Page views and daily active-user charts change the traffic metric. Summing daily active-user counts does not yield unique users across the whole period.
4. Multiple clients, method changes and settings transfer
Keep Google and JSON connections side by side
A saved Google connectionA saved JSON connectionAssign a saved connection to each website
Read the instructions
Add each intended connection with a recognisable client/account name.
Give that identity access to its required properties.
In My Websites, select the intended Connection on each row and Save settings.
Test affected websites before removing an old key or authorisation.
One website row uses one method at a time. Different rows may use different methods for properties under the same or different Google accounts. Removing access in Google can affect every website using that authorisation or key.
Export and import settings without confusing the two JSON files
Start in My Websites
Read the instructions
On the source installation, save edits in My Websites, then use Copy settings to another site to download the transfer file.
Decide whether to include JSON connections. If included, the file contains private keys and must be handled privately. Google sign-in tokens are never included.
On the destination, sign into the intended Trenscope account. Open My Websites → Import the downloaded file, select the exported transfer JSON and press Import settings.
Import replaces that customer’s dashboard settings and keeps existing saved connections. Included JSON keys are added as separate connections.
Connect Google sign-in separately on the destination. For rows without an imported credential, choose an available saved Connection, Save settings and test.
Invalid import file
A Google service-account key belongs in Manage connections, not Import settings. Import settings expects the Trenscope transfer file downloaded from the source.
Imported rows need a connection
A transfer does not recreate a Google sign-in session. Add the required connection on this installation, select it on those rows and save.
Duplicate or unexpected connection names
Identify the intended saved entry by its method and service-account email where available. Check website assignments before removing anything.
5. Subscription access and public demos
Billing, permitted countries and subscription access
The Trenscope subscription page
Read the instructions
Trenscope is €9.99 per month, with applicable taxes and the final total shown before payment. Only the 82 countries listed in the homepage footer can purchase.
Start from the intended Trenscope account so the purchase is attached to the correct customer.
If payment is completed but access is absent, check Billing, reload once and contact support with the receipt reference and approximate time. Do not pay again simply to try to unlock access.
Use Billing to manage or stop renewal. Read the displayed subscription status; stopping renewal and deleting a profile are different actions.
Never send card details, passwords, Google tokens or private keys to support.
Demo Summary and Demo Dashboard are free and public. They share 30 fictional websites, five groups and nearly three years of daily sample data. The fixed snapshot is 31 October 2026, through 30 October in UTC. Demo controls do not connect Google or save customer websites. Monthly and regional numbers match across both views; different indicators still use their stated comparison periods.
 Trenscope